
Why a High Completion Rate Doesn't Always Translate Into Business Impact
A high completion rate is usually one of the primary targets a training program aims to hit. But the question remains: is this metric enough to measure improved business performance?

The MOOC Phenomenon and the Rise of the Completion Rate Metric
A high completion rate is usually one of the primary targets a training program aims to hit. But the question remains: is this metric enough to measure improved business performance?
Udemy, Coursera, and LinkedIn Learning have revolutionized how we learn through Massive Open Online Course (MOOC) platforms. Anyone can now access a wide range of classes online to build whatever skill they want. But behind all that flexibility, how effective are MOOCs really?
The success of MOOC platforms is typically measured by an indicator called the completion rate: the metric that measures the percentage of learners who finish a program or course from start to end.
Since MOOCs emerged around 2012, one of the main criticisms has been that although thousands of people enroll, only a small fraction finish the entire program. Unfortunately, official enrollment and completion data is often not published by platform providers.
Katy Jordan, a researcher at The Open University (UK), systematically gathered data on completion rates to understand the patterns and factors behind MOOC completion.
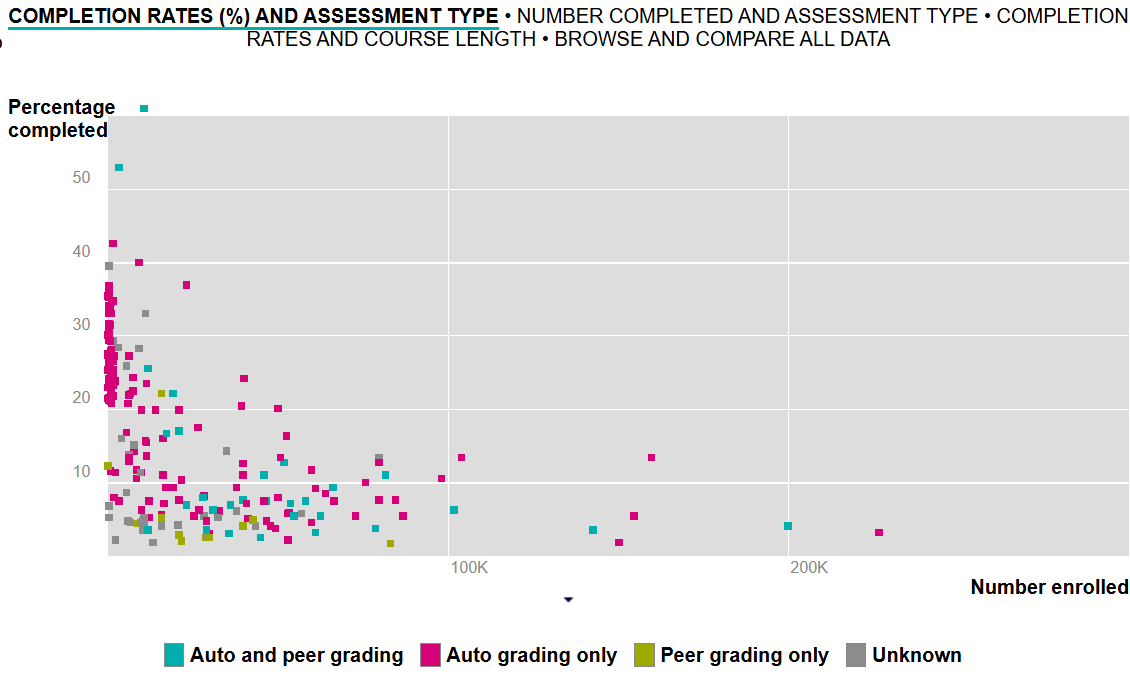
Data from Katy Jordan's 2015 MOOC project shows the percentage of students completing selected courses across more than 90 universities worldwide. Completion rates varied widely, from 0.7% to 60%. While the average sat around 15%, quite a few courses actually had a completion rate above 20%, with 60% as the highest.
The ease of accessing course material gave rise to a new phenomenon known as impulse enrolling — high enthusiasm to sign up at the start, which then fades along the way. That wide variance proves that completion rates depend heavily on how the material is delivered and on learner motivation.
When Completion Rate Becomes a Metric Out of Step with Impact-Oriented L&D
From a management perspective, a high completion rate can create the illusion that every employee has understood the full set of operating standards. In reality, completion rate isn't necessarily aligned with comprehension.
When completion rate is adopted blindly as the benchmark for success in corporate Learning & Development (L&D), it often becomes a problem, because this metric tends to be out of step with L&D goals that are oriented toward impact.
An analysis of 221 MOOCs collected by Katy Jordan revealed an interesting correlation: completion rate is influenced by start date, duration, and assessment type. Longer courses tend to have lower completion rates, while courses with automated assessments tend to have higher ones.
This fact shows that completion numbers often reflect course design more than they reflect learning quality or its impact on performance. In a corporate context, an employee might finish a module with a 100% score but still be unable to apply that skill to solve a real problem at work.
When evaluating training, we need to look at the difference between Level 1 (reaction) and Level 2 (learning) in the Kirkpatrick model, versus Level 3 (behavior) and Level 4 (results).
Completion rate only sits at Level 1 — it merely tells you that someone showed up digitally, but says nothing about whether any behavior change or performance improvement actually occurred.
Data from Katy Jordan's research reinforces this argument. The finding that courses with auto-grading have higher completion rates than those using peer-grading or more complex assessments shows that what drives completion rate is simply ease.
If the goal of L&D is to create learning that's shallow but quick to finish, this metric is sufficient. But if the goal is skill transformation that drives productivity, completion rate can actually become a counter-productive metric.

Repositioning Completion Rate
So how do we reposition completion rate? This metric needs to become part of a broader measurement ecosystem. In a corporate L&D context oriented toward business impact, relying on a single activity metric like this can actually mislead company decision-making.
To make completion rate more relevant within a modern L&D ecosystem, here are a few strategic approaches worth adopting:
1. As a Leading Indicator
We need to reposition this metric as an early warning system. A low completion rate can signal several possible issues:
– Technical access barriers: the platform isn't user-friendly, material isn't accessible from mobile devices, or there are connectivity issues.
– Poor content design: material that's too long, irrelevant, or unengaging for the target audience.
– Lack of managerial support: employees aren't given the time or encouragement to finish the training.
In this context, completion rate serves to flag that something needs to be checked. Data from Katy Jordan shows that the first and second weeks are the critical period for learner retention. If completion rate drops sharply during this phase, design or communication interventions need to happen right away.
2. Pair It with Outcome Metrics
Completion rate should always be paired with metrics that measure real-world results. A few examples of outcome metrics worth combining it with:
– Skill Application Rate: the percentage of participants who report or demonstrate applying the skills they learned on the job within 30-60 days post-training.
– Performance Improvement: changes in individual or team performance metrics (for example, a rise in sales, a drop in errors, or improved customer satisfaction) that can be attributed to the training program.
– Manager Feedback: evaluation from direct supervisors on changes in employee behavior or competence after completing the training.
– Business Impact: effects on macro business indicators such as revenue per employee, customer retention, or time-to-market.
With this approach, organizations can spot far more meaningful patterns. For instance, a program with a 40% completion rate but an 80% skill application rate is far more valuable than one with a 90% completion rate but only a 10% application rate.
Repositioning completion rate is, at its core, part of a much bigger shift happening in L&D: the move from an activity-centric paradigm toward an impact-centric one.
Monkey Melody understands that every company faces different challenges and goals.
That's why we offer a tailored approach to ensure every video we create achieves the intended training objectives. Ready to transform your company's training material into effective video learning or interactive video?
Contact Monkey Melody now via WhatsApp at +62 812-1954-8155, email info@monkeymelody.com, or through the link below.
More insights
Research on Interactive Video Among Biology Students
The use of video as a self-paced e-learning medium has become standard practice in corporate training programs and higher education.
The Science Behind Why Microlearning Works
A single long training day often fails because it fights how the brain actually works — see how microlearning, the Forgetting Curve, and spaced repetition make material actually stick.

How AI Video Search Is Transforming Corporate L&D
Thousands of hours of training video pile up in your company's LMS, hard to search once a program ends — see how AI Video Search is changing the way L&D teams find specific moments buried in that dark data.
Want the short version, applied to your company?
Let's talk about what this means for you.
Get in touch